M4 Macbook air, 26.0.1. It worked a week ago when I set up my cnc router, all of my tools, and custom macros, but today I loaded a depth map into it and pressed the Trace Edges button, only to be met with a white screen. So I killed it and relaunched, and now it just says “Kiri:moto is Loading”. Interestingly, if I hit localhost:5309, it loads in the browser, but my machine and all of my tools are gone. I rebooted also and that had no effect, the desktop app still just says loading, and all of my config is gone if I hit with the browser. I have run into problems where running multiple CAD/CAM tools at the same time cause some to have problems, but only Bambu studio was running when I Kiri was working, and after the reboot, I didn’t load any other 3d stuff.
How can I troubleshoot this? I tried launching it from the cli with –debug, but that doesn’t seem to be valid. I really do not want to lose all of the configuration I did in this. Is there a file with my machine and tool settings that I can grab and then just blow everything away and move that file back into place?
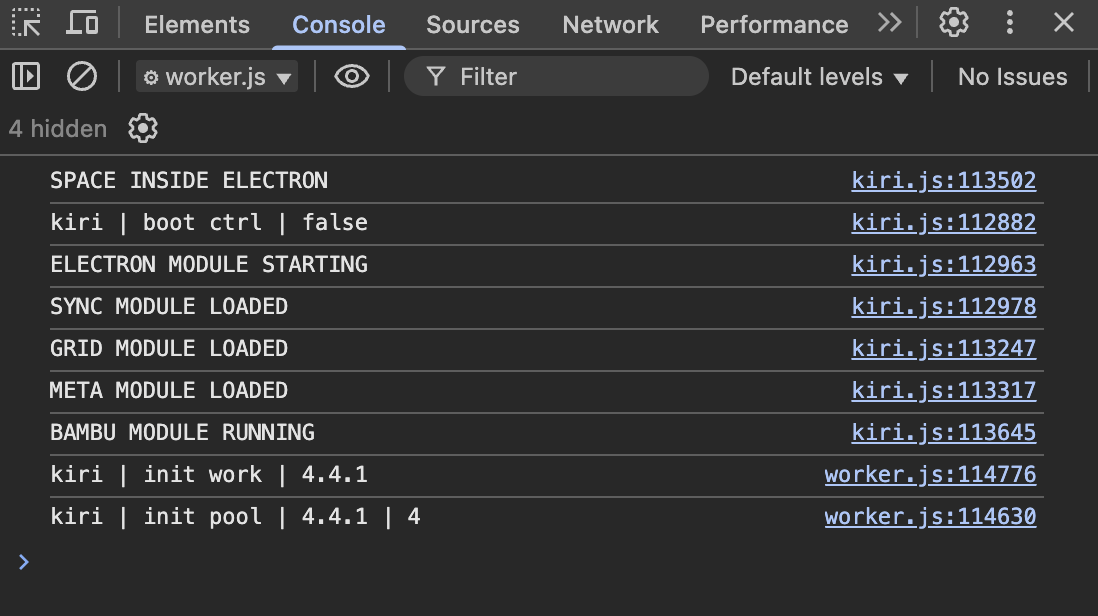
your settings and tooling are not lost. once we get past the startup crash, it should all be there. I haven’t updated any of my macs to 26.x yet (heard worrying things). to start up in debug mode (including JS console)
let me know what you see on the console and inside the app under the developer tools console.
also, good practice to export your workspace from time to time. that can be used as a checkpoint and restored into any version of Kiri running on the web or inside the app.
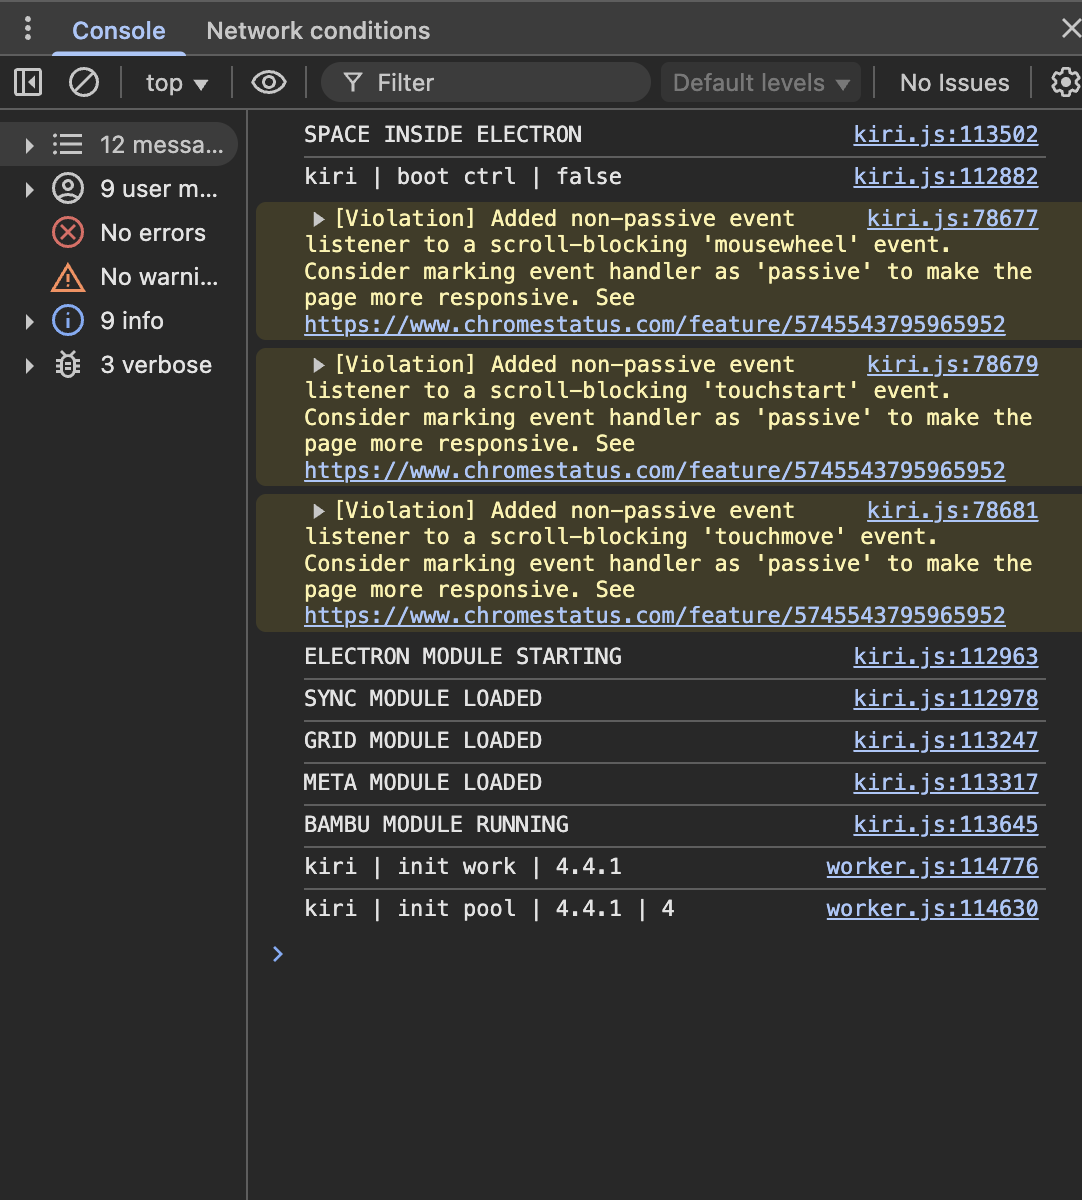
That didn’t work. But I opened the sidebar in the debug console, and these errors showed up when I did that. The cmd-shift-r didn’t do anything noticeable at all. Should I just delete everything in the Cache directory and start it again?
there are notable bugs with Mac OS 26 for all versions before 26.2 (some specifically impact electron apps) … try upgrading and see if that resolves it.
I’m going to try updating macos first. This should have been autopatched but wasn’t for some reason. When I press enter after any of those commands, nothing happens, like no linefeed or anything.
It didn’t help. And Enter doesn’t submit any of the commands you posted above. I hit F1 and restored to defaults for the inspector, but that didn’t help either. Hrm…
Aren’t the machine and tool settings in leveldb, not the cache?
large binaries (objects, etc) are in the indexeddb but preferences, tools, settings are in localStorage. everything will be migrated to indexeddb in an upcoming release. I’m not sure how to debug if the console isn’t responsive and there are no app error messages.
if you have node setup, you could try cloning the repo and running electron from the cmd line. takes about 3-5 minutes to run the first time. it will use the same stored app preferences from the provided build.
git clone git@github.com:GridSpace/grid-apps.git
cd grid-apps
npm run setup
npm run start
There’s a directory in Local Storage called “leveldb”. It looks like that might have my machine and tool settings in it.
I guess I could give up at some point and just re-enter it all, but it will take me at least an hour or two to find everything that I set and get it back in there. Plus, measuring all of these tools.
So, I’m just going to blow it all away and reinstall/reconfigure. But, this might be helpful for someone. I found all of my configuration in ~Library/Application Support/grid-apps/Local Storage/leveldb/leveldb000XX.log (where XX is some random number)
That .tools command above looks like it ran and put this all in JSON in this file, even though it didn’t look like it ran in the console.
I just uploaded the file to chatgpt and told it to export this all in an easy to read table with the settings I needed to put back in.